
Metrics
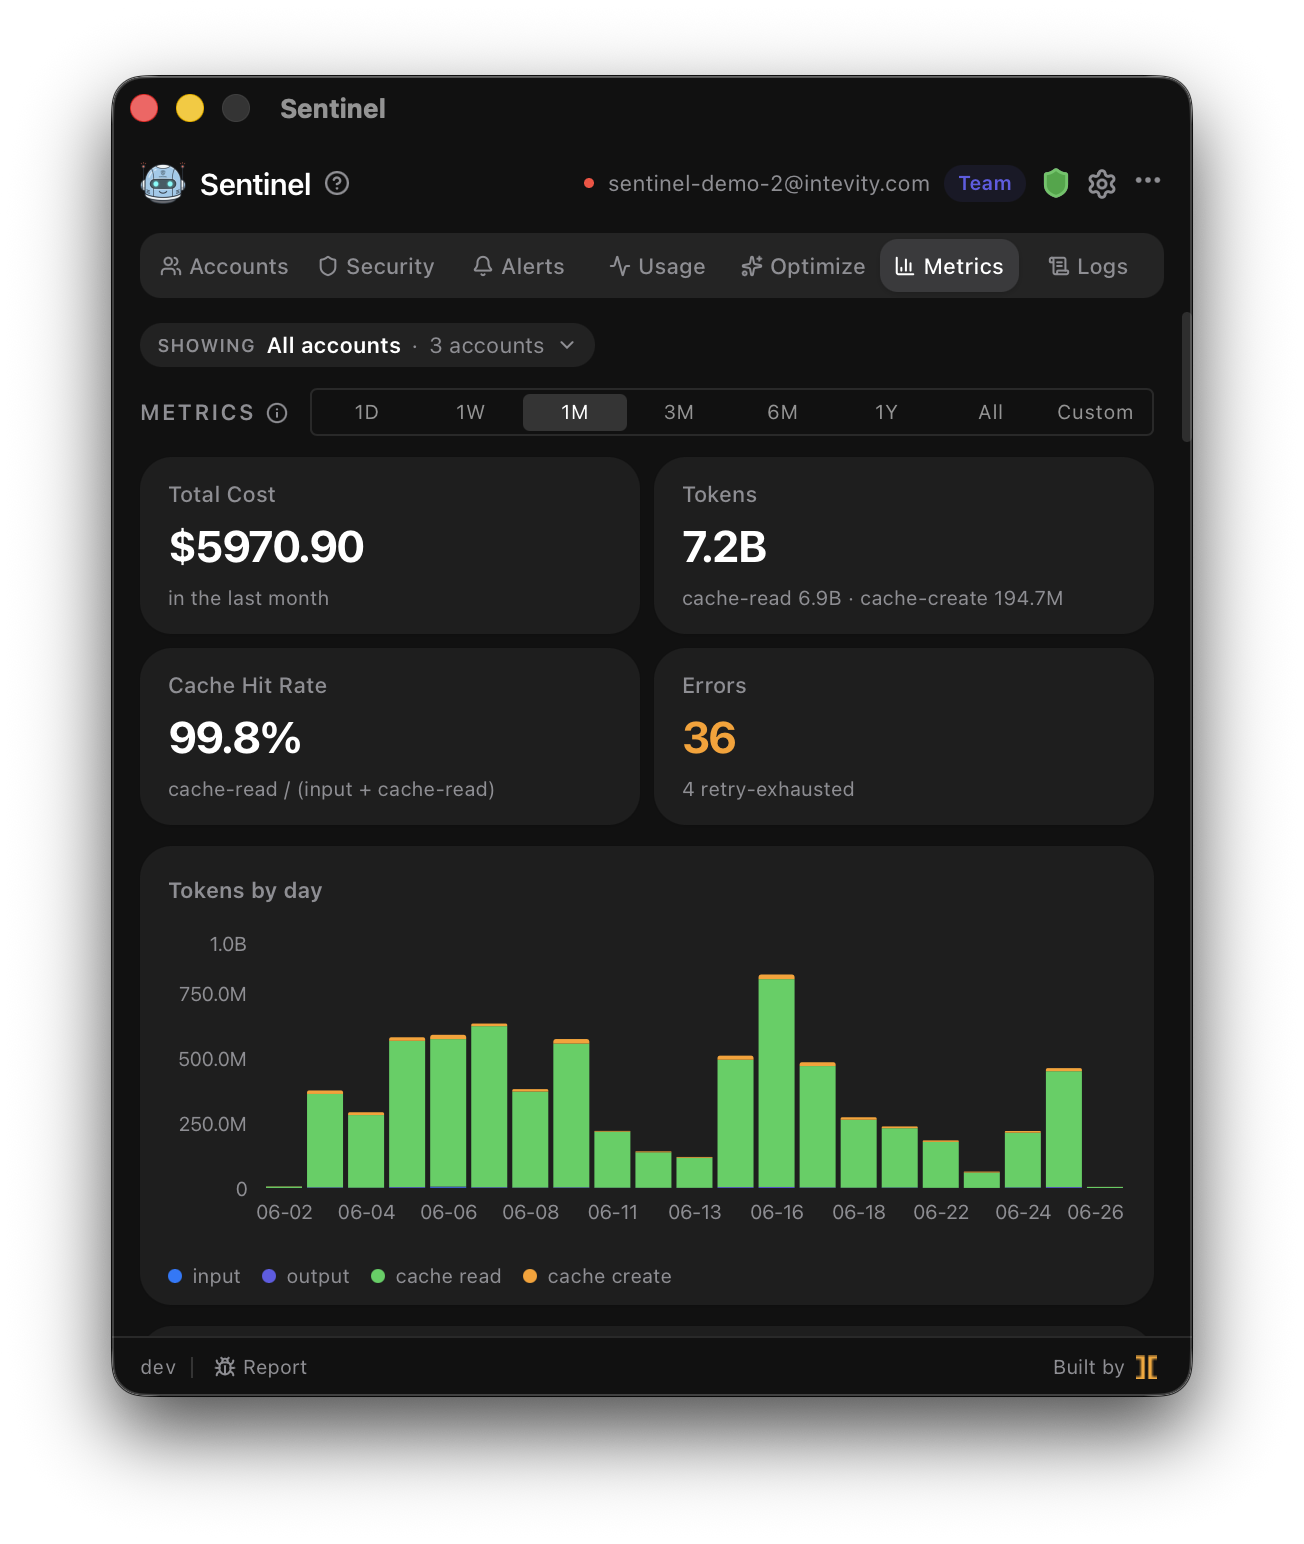
The Metrics tab gives you real analytics on what your Claude Code usage actually costs — cost, token counts, cache hit rate, and per-model breakdowns over 7-, 14-, and 30-day windows.
Where the data comes from
Section titled “Where the data comes from”When you activate Sentinel, it also configures Claude Code to emit OpenTelemetry (OTel) telemetry to the daemon’s local OTLP receiver. The daemon aggregates those spans into the metrics you see.
What you can see
Section titled “What you can see”- Cost over the selected window, with a per-model breakdown.
- Tokens — input, output, and cache reads/writes.
- Cache hit rate — how much of your context is being served from prompt cache.
- Time ranges — switch between 7, 14, and 30 days.
Telemetry stays local
Section titled “Telemetry stays local”The OTLP receiver listens on localhost only. Telemetry is stored in the local SQLite database and never leaves your machine. Advanced users can optionally forward OTel to their own exporter; that’s covered under Settings.