
Connect your first backend
A backend (Trove also calls it a platform) is the observability
destination you already own — where your spans, metrics, and logs land.
Trove forwards everything there and nowhere else: the collector binds
to 127.0.0.1 and exports only to the endpoint you configure. Your
telemetry never reaches Trove or Intevity.
This guide gets one backend connected and verified. Once the health pill is green, every harness you enable afterward flows straight to it.
Before you start
Section titled “Before you start”You need the ingest details for an observability backend you control. Trove ships first-class presets for 15 destinations — SigNoz, Grafana Cloud, Honeycomb, Datadog, New Relic, Splunk Observability, Dynatrace, Elastic, OpenSearch, OpenObserve, ClickStack, Chronosphere, and Sentry — plus Generic OTLP for any other OTLP-compatible endpoint and Local Collector passthrough for a collector you already run.
Each preset knows the right OTLP endpoint shape and which credential it needs (an ingest key, an API token, or nothing for a local loopback endpoint). Have that value handy from your backend’s settings before you begin.
Add the backend
Section titled “Add the backend”-
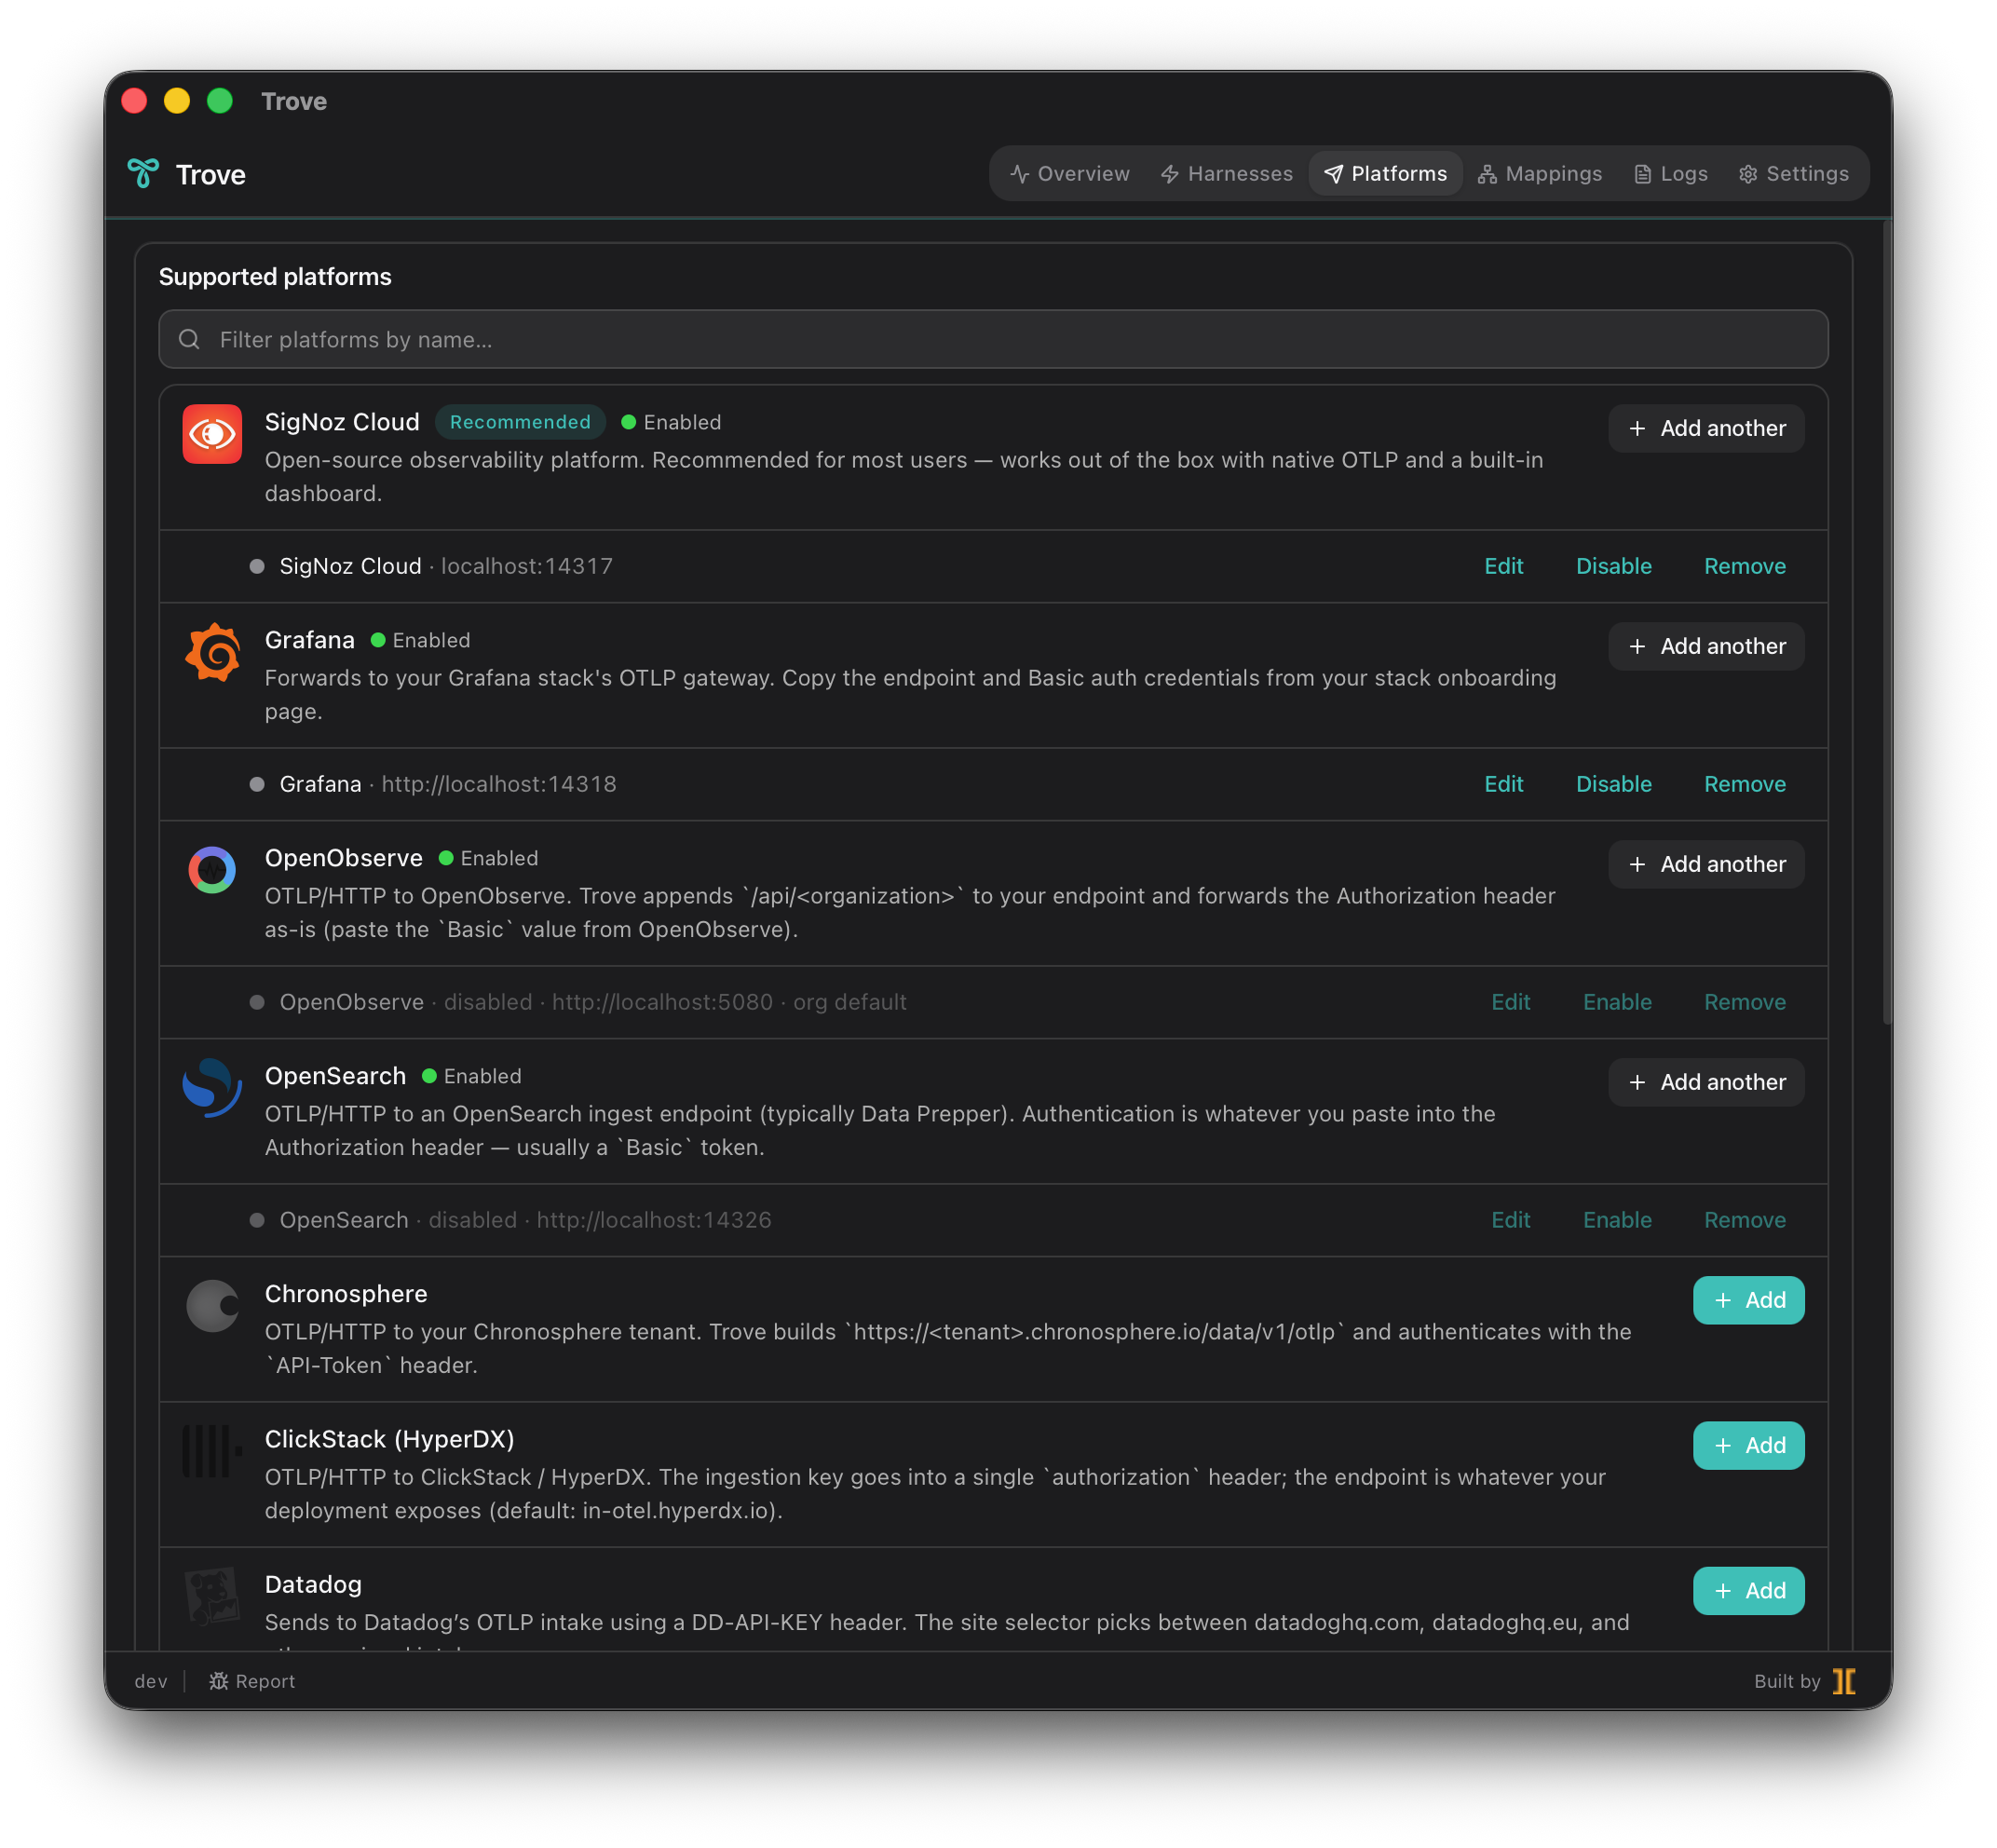
Open Trove from the system tray and select the Platforms tab.
-
Choose your backend from the preset list (for example, Honeycomb or SigNoz). Trove pre-fills the endpoint format and shows only the fields that preset actually requires.
-
Enter the OTLP endpoint for your backend. Cloud presets usually pre-fill the host; you confirm the region or your account’s ingest host. For a self-hosted backend, enter the host and port you exposed (for example a loopback gRPC endpoint like
localhost:14317). -
Paste your ingest credential (API key / ingest token). Trove writes it to the OS keychain — macOS Keychain, Windows Credential Manager, or the Linux Secret Service — never to a plaintext config file. The value lives in secure OS storage and Trove reads it only when generating the collector’s runtime config.
-
Save the backend. Trove regenerates the bundled collector’s
collector.yamlwith an exporter for this destination and reloads the collector. Expect a brief (1–3 second) reload while the new pipeline comes up.
Verify the health pill turns green
Section titled “Verify the health pill turns green”Each backend row in the Platforms tab carries a colored health pill driven by the collector’s live exporter counters and error stream:
- Gray — no telemetry has been sent yet. This is normal immediately after saving, before any harness emits.
- Green (pulsing) — batches are being accepted by your backend. You’re connected.
- Amber — some batches are succeeding and some are failing. Check the expanded row detail for the recent error.
- Red — the exporter has a recent error and no recent successes (typically a wrong endpoint or a stale credential stuck in retry).
-
Generate a little traffic so there’s something to forward. The fastest way is to enable a harness you already use, then run one prompt through it.
-
Back on the Platforms tab, watch the row. Within a few seconds of the first batch, the pill should move from gray to green.
-
Click the row to expand the inline detail panel. It shows 60-second window counters (batches sent / failed) and the last error string, if any.
What you’ve built
Section titled “What you’ve built”You now have a localhost-only pipeline: harness → bundled OTel Collector → your backend. The credential sits in your OS keychain, the collector forwards only to your endpoint, and the whole patch is reversible. From here you can add more harnesses, normalize their signals into Trove’s cross-vendor Tier A schema, or fan the same stream out to several backends at once.