Quick start
This guide takes you from a fresh install to live, unified telemetry in about five minutes. It assumes you have already installed Trove and have at least one supported AI coding harness on your machine.
-
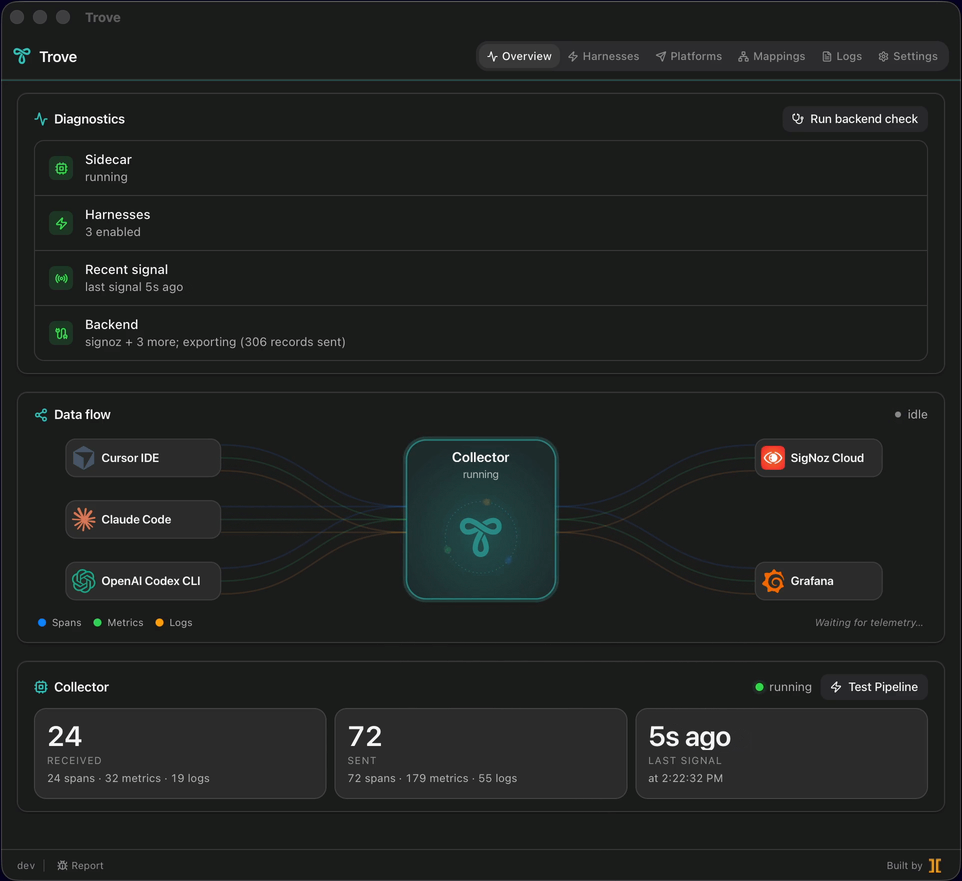
Open Trove. Click the tray icon to bring up the dashboard. You land on the Overview tab, which shows overall health and a live data-flow chart from your harnesses, through the collector, to your backends.
-
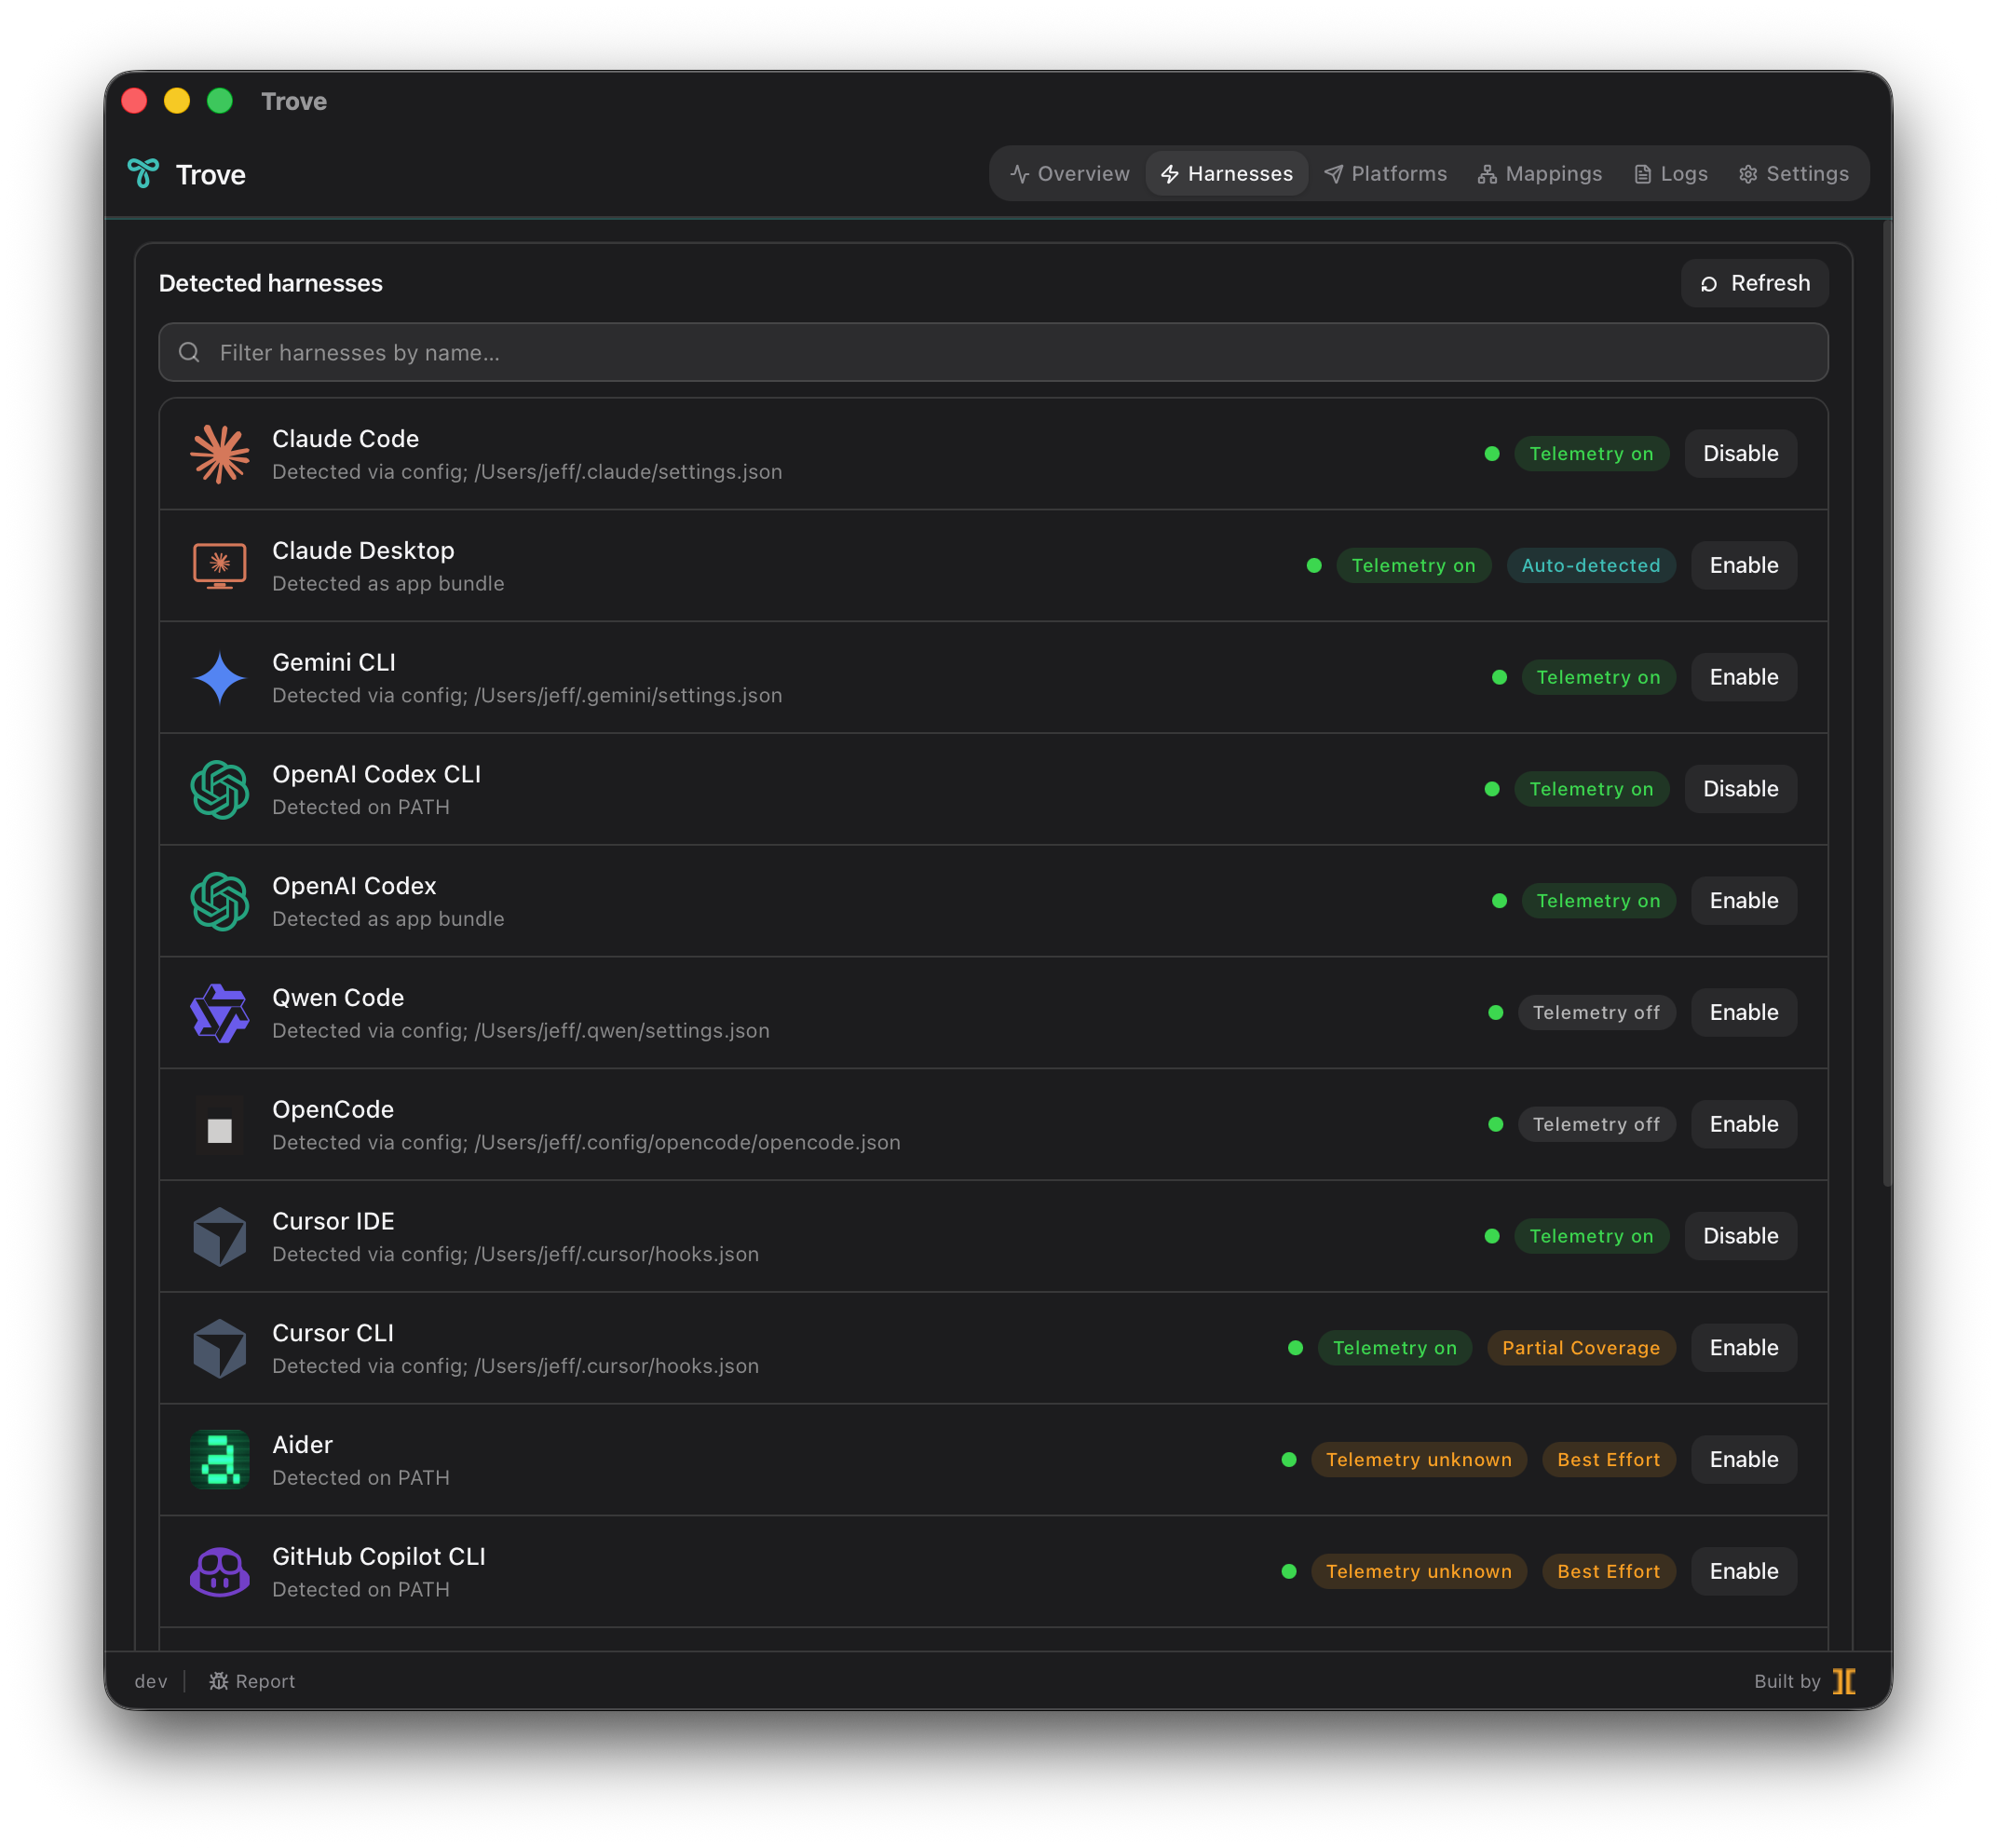
Review auto-detected harnesses. Switch to the Harnesses tab. Trove has already swept the standard install paths and listed every supported AI coding tool it found on disk, each with a coverage badge (native OTel or best-effort) and a telemetry status pill.
-
Enable one harness. Pick a tool you actually use and click its Enable toggle. Trove writes a sentinel-bracketed managed region into that harness’s config so it emits OTLP to the local collector. For native-OTel harnesses this just flips the right flags; for best-effort harnesses it installs a watcher or shell-rc wrapper. The change is fully reversible — toggle Disable and Trove restores the original file byte-for-byte.
-
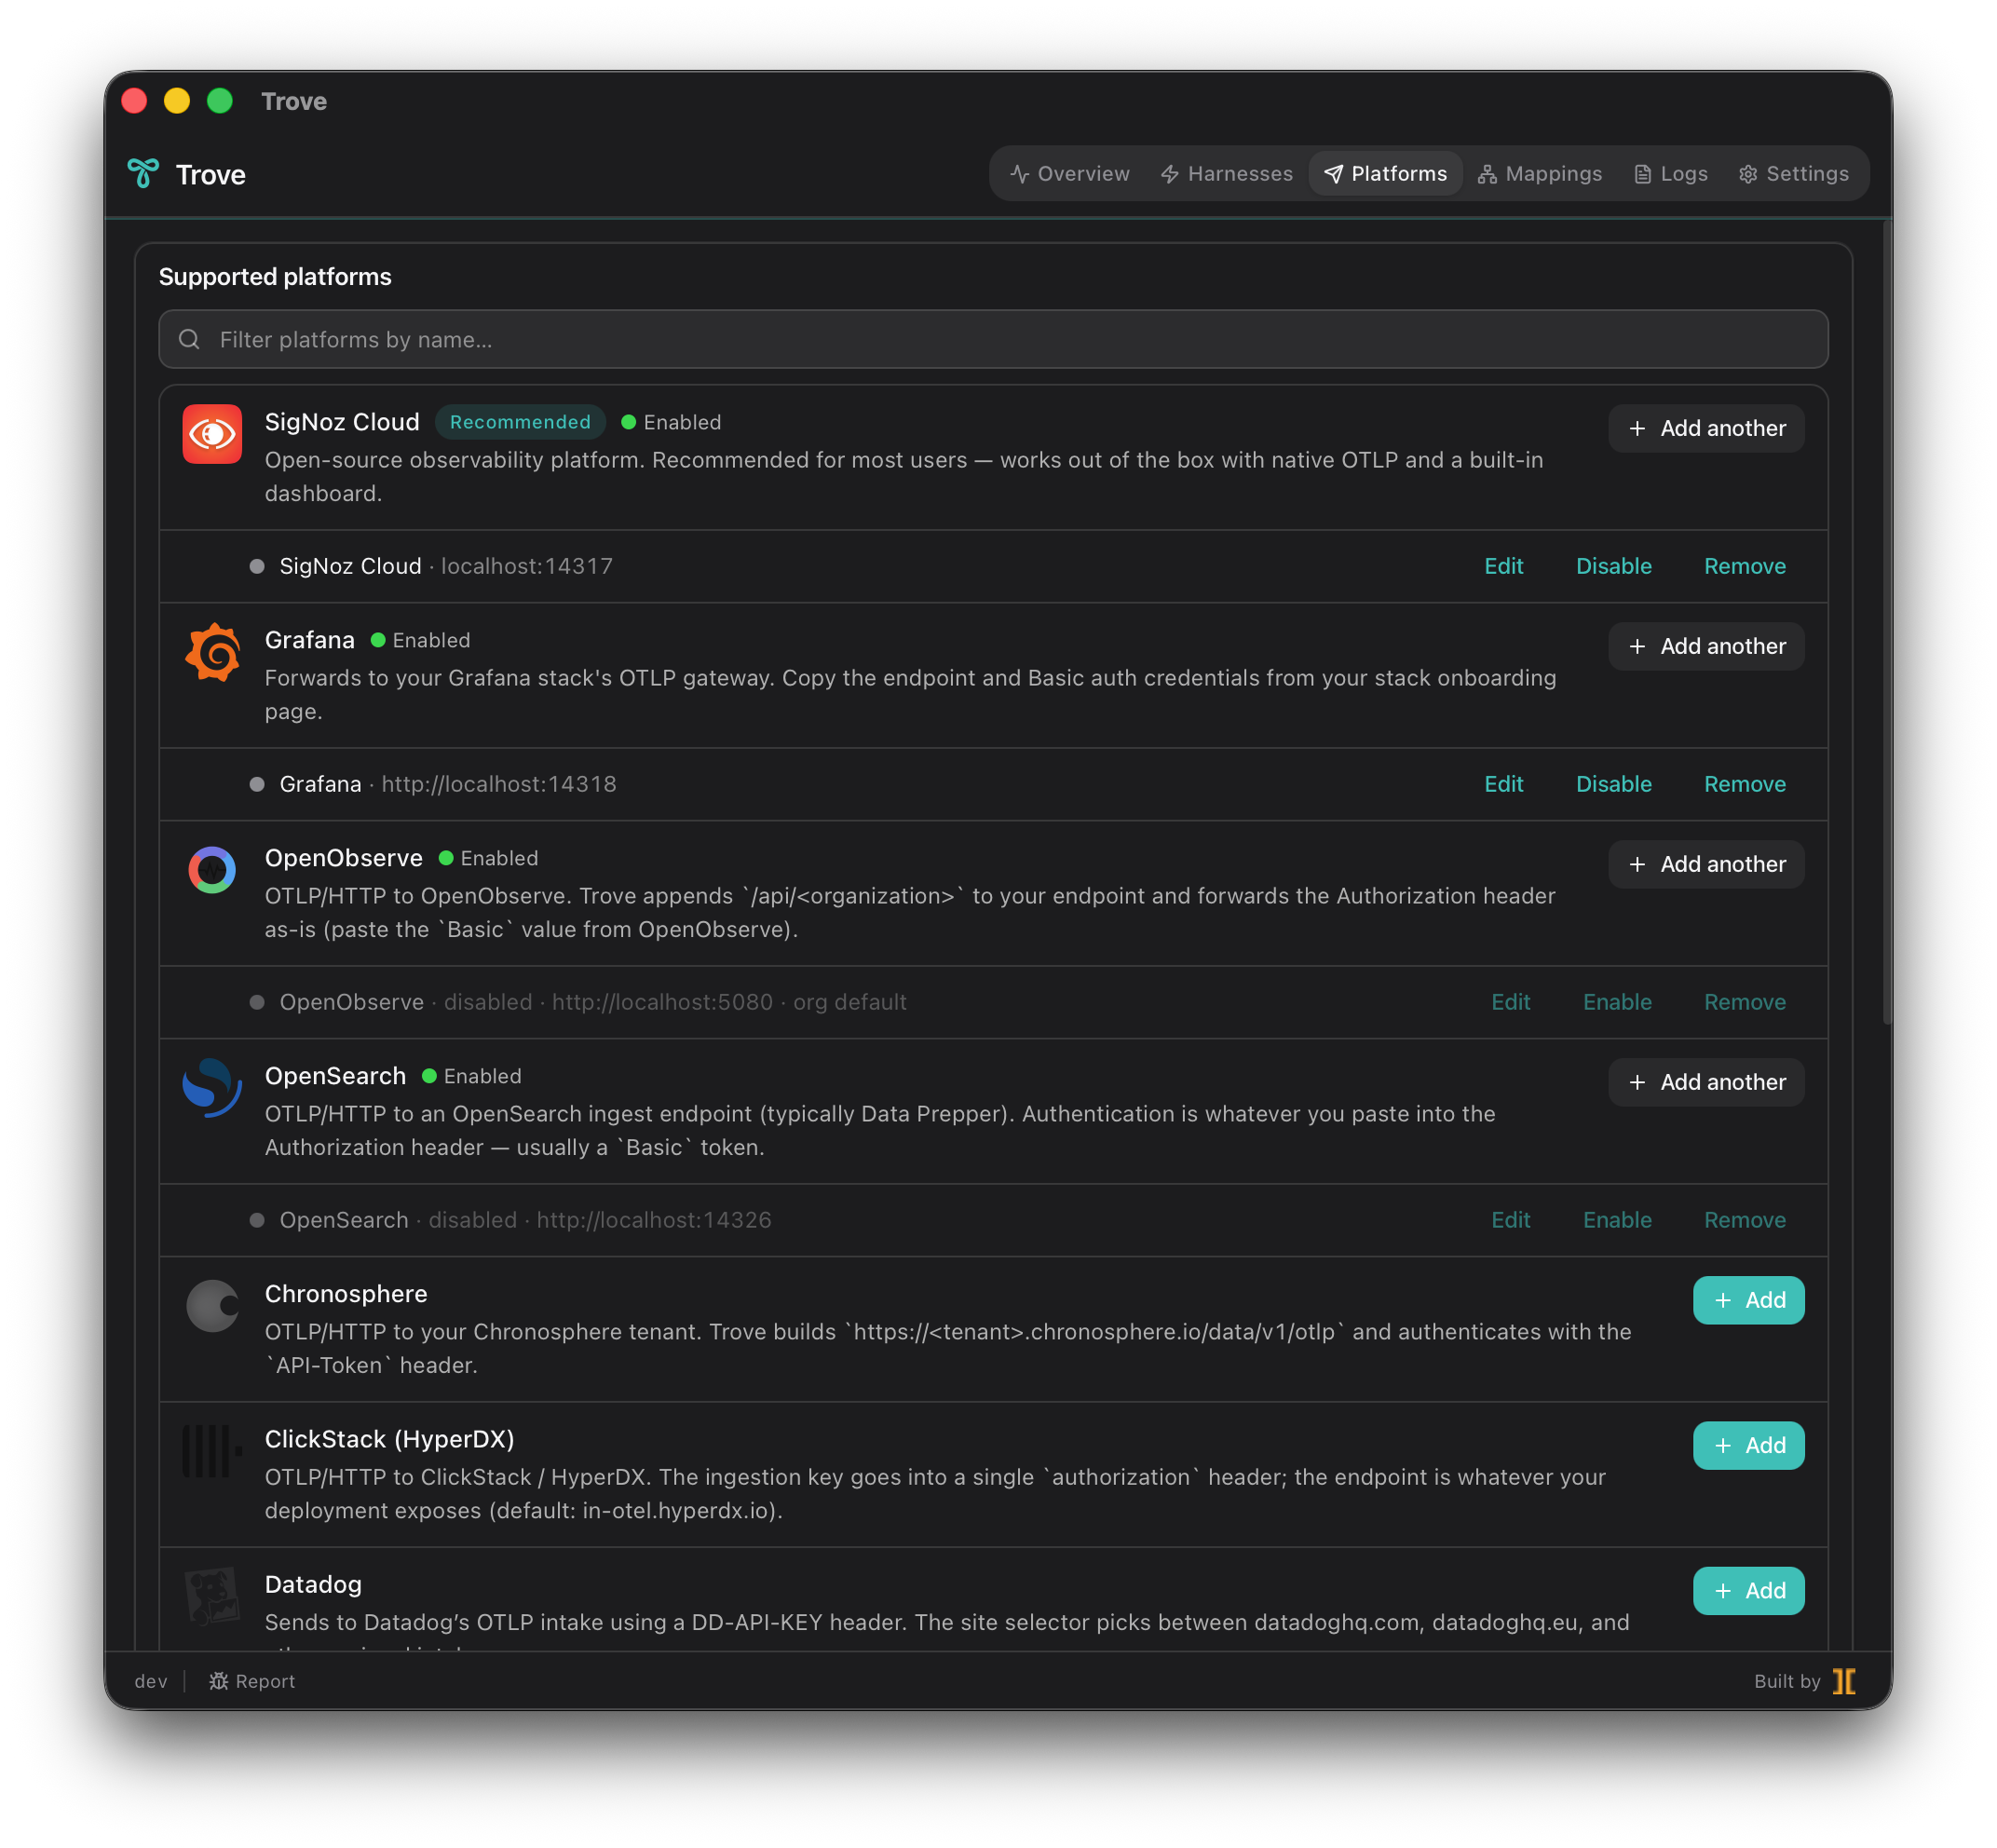
Add a backend on the Platforms tab. Open the Platforms tab and add the observability backend you want to forward to. Each backend has a tailored credential form; Trove stores what you enter in your OS keychain. If you already chose a destination in the first-launch wizard, it is here — and you can add more, since Trove broadcasts every signal to every enabled backend.
-
Generate a little activity. Run a quick prompt or turn in the harness you just enabled. This gives the collector real signals to receive, normalize, and forward.
-
Watch the Overview go green. Back on the Overview tab, the data-flow chart comes alive as telemetry flows: the source halo for your enabled harness lights up, and the row’s telemetry pill turns green — typically within about five seconds. Each configured backend shows a health pill (green / amber / red / gray) driven by the collector’s own scrape metrics.
-
Confirm in your backend. Open your observability backend’s own dashboard. Spans, metrics, and logs land tagged with
harness.idandservice.name, alongside the normalized Tier A metric set (trove.harness.events,trove.harness.tokens,trove.harness.cost.usd,trove.harness.turn.duration,trove.harness.errors).
That’s it — no daemons to babysit, no agents to upgrade, no SaaS account to create. From here, you can enable the rest of your harnesses, add more backends, and customize how raw signals map onto the Tier A schema.