The Overview tab
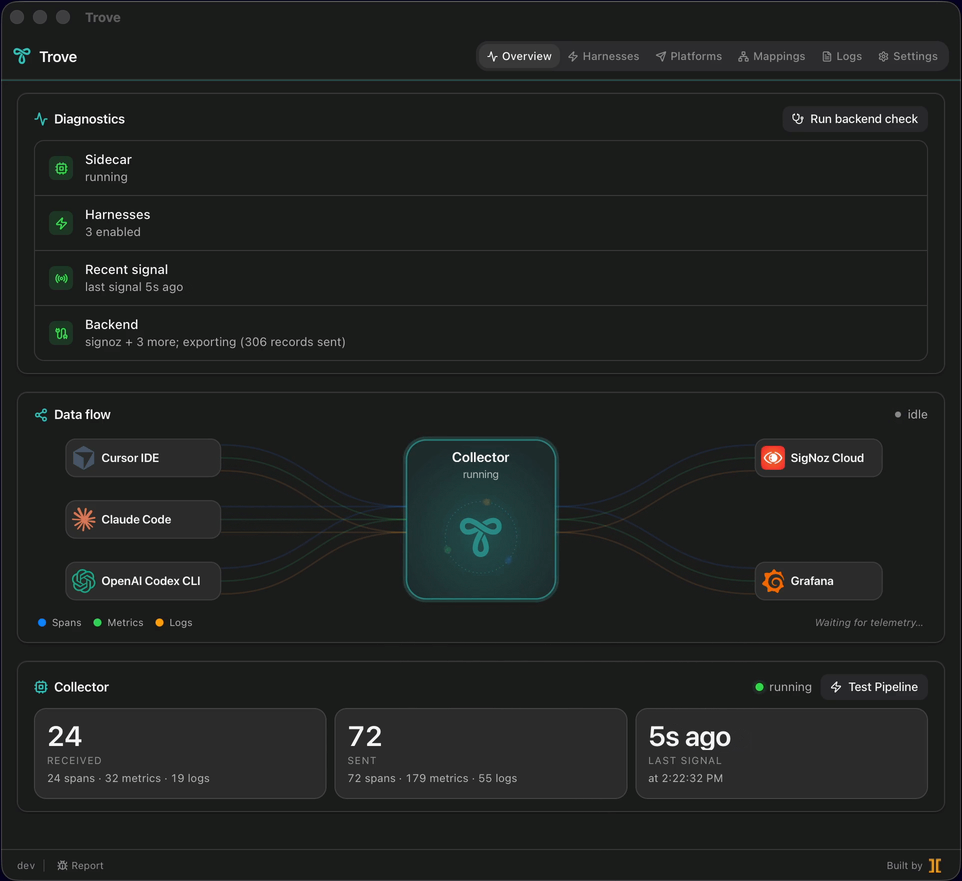
The Overview tab is the first thing you see when you open Trove. It answers one question at a glance: is telemetry flowing, and where is it going? It pairs a health summary with a live data-flow chart that traces every signal from the AI coding tools on your machine, through the bundled collector, out to the observability backends you configured.
Health summary
Section titled “Health summary”The top of the tab is a status band that rolls up the whole pipeline:
- Collector state — whether the bundled OpenTelemetry Collector sidecar is running, starting, or has crashed. The Rust core supervises the sidecar and restarts it on crash, so a transient blip self-heals; a persistent red state points at a config or binding problem.
- Active harnesses — how many of your detected harnesses are enabled and emitting.
- Active platforms — how many backends are enabled and receiving, with their aggregate health.
- Signals received / sent — running counts of OTLP signals the collector has accepted from harnesses (received) and forwarded to your backends (sent).
The data-flow chart
Section titled “The data-flow chart”The centerpiece is an animated graph of your live pipeline:
harnesses ──▶ Trove collector (localhost) ──▶ your backends (sources) normalize · tag · fan out (destinations)Each enabled harness appears as a source node on the left. Activity halos
pulse on a node whenever telemetry is actively flowing from that tool, so you can
watch a claude -p turn or a Cursor agent response light up the graph in real
time. The collector sits in the middle; your enabled backends fan out on the
right, each carrying the same health pill you see on the
Platforms tab.
The Orbital Hub
Section titled “The Orbital Hub”With three or fewer enabled harnesses, each renders as its own labeled node. The moment you cross four or more, the source nodes collapse into a single animated cluster — the Orbital Hub — so a busy machine with a dozen tools stays legible instead of turning into a tangle. The hub keeps the per-source activity halos: you still see which tools are firing, just grouped into one orbiting constellation rather than a row of separate boxes.
Collector and sidecar diagnostics
Section titled “Collector and sidecar diagnostics”The Overview tab is also where the collector’s own health surfaces. The sidecar is a supervised child process of the Trove core: it is spawned at startup, monitored continuously, restarted with backoff on unexpected exit, and shut down cleanly when you quit the app. Overview reflects that lifecycle:
- A healthy collector means the OTLP receiver is up on
127.0.0.1and the health endpoint is responding. - A starting state appears briefly after a config change — applying new harness or platform settings regenerates the collector config and triggers a short reload (a 1–3 second blip is normal).
- A crashed or failed state is your cue to open the Logs tab, where the collector’s stderr tail usually names the cause (a bad endpoint, a missing binary, a port conflict).